The previous post included data about the prevalence of COVID-19 in Vermont and I concluded: "At least for the present, COVID-19 is fading away in Vermont." What about other states, and the country in total?
The Washington Post has statistics for all 50 states, the District of Columbia, U.S. territories, and the U.S. in total. No subscription is required to access this page:
The statistics are presented graphically in a manner similar to my previous post about Vermont: cases and deaths, per day and the 7-day average. Following are graphs for the United States in total. Both cases and deaths are trending down:
(Click on any image to enlarge. Sreenshots captured on May 29.)
Total deaths in the United States recently passed the sad milestone of 100,000. In Past Pandemics I noted that U.S. deaths were estimated to have been 100,000 from the 1968 flu pandemic, 116,000 from the 1957 flu pandemic, and 675,000 from the 1918 flu pandemic. U.S. deaths per 100,000 population (rounded to the nearest multiple of 10):
| 1918 flu | 650 |
| 1957 flu | 70 |
| 1968 flu | 50 |
| COVID-19 to date | 30 |
What about our neighbors? Here in Vermont we get a lot of visitors from neighboring states. Following are COVID-19 deaths to date per 100,000 population (rounded to the nearest multiple of 10):
| Massachusetts | 100 |
| New Hampshire | 20 |
| New York | 150 |
| Vermont | 10 |
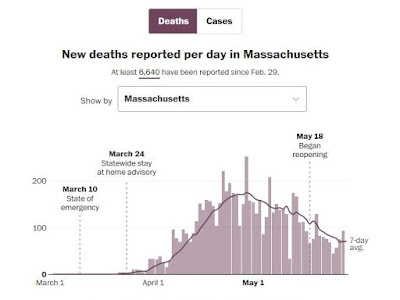
New York and Massachusetts are significantly worse than the national average of 30, but both states are trending down for both cases and deaths:
Here is the link again if you are interested in data for other states:


No comments:
Post a Comment